Grow your businesses with Dot Analytics
We don’t just understand data, we understand your industry
Our expertise in key industries allows us to deliver solutions that align perfectly with industry standards and expectations.
Types of Dashboards. Overview
Our Dashboard Consulting Services
Full-Cycle Solutions from Concept to Execution
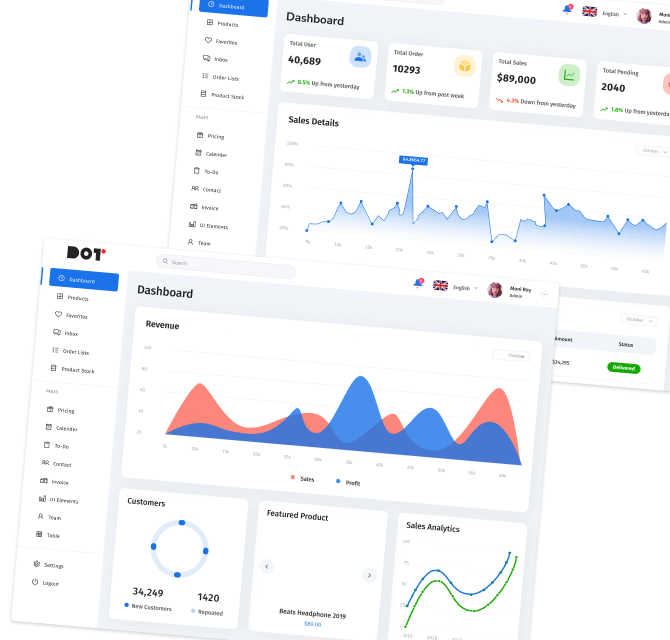
Dashboard Reporting & Consulting Services. Business Dashboards Types we do:
-
Marketing Dashboards
✔ Track key metrics: Engagement Rate, CAC, LTV, LTV to CAC, ROAS.
✔ Spot trends in CAC and drops in conversion rates and identify high-performing campaigns to scale x2.
-
Product Dashboards
✔ Monitor product performance and growth: MAU, DAU, Conversion Rate and Churn Rate.
✔ Track user behavior, measure retention, satisfaction and feature adoption — all in one view.
-
Sales Dashboards
✔ Check sales outcomes: Lead CR, Sales/Rep, Revenue Growth Rate, Total Sales Revenue.
✔ Evaluate team performance, update lead-to-revenue workflows, and boost overall sales efficiency.
-
Financial Dashboards
✔ See all of your finances in one place: Total Revenue, Revenue Growth Rate, Gross Profit Margin, Net Profit Margin, Cash Flow.
✔ Track your budget and optimize expenses.
-
Ops + CS Dashboards
✔ Real-time ops metrics tracking. Know your FRT, FCR, CSAT, Agent Performance, etc.
✔ Share dashboards with your team to let them act fast.
-
*Custom Dashboards
✔ Fully customized and based on your unique business needs.
✔ Built to fit any specific industry or function.
Enable Data-Driven Decisions That Deliver ROI
Case Studies
Success Stories in Dashboard Consulting
-

iGaming
GRP.co
Project Outcomes
Optimized GRP.co’s marketing efforts, leading to 25% CAC reduction (customer acquisition costs) and improved data management with advanced tracking and AI-driven solutions.
Reduction in СAC (Customer Acquisition Costs)
– 0 % CACUsed Technology
-
Voluum
-
Looker Studio
-
Google Analytics 4
-
Google Tag Manager
-
Python
-
dbt
-
Cloud Run
-
Vertex AI
-
-

E-commerce
uWeed
Project Outcomes
Enhanced uWeed’s data tracking and analytics, driving a 32% increase in CR (conversion rates) and a 17% boost in repeat purchases.
Increase in CR (Conversion Rates)
+ 0 % CRUsed Technology
-
Google Analytics 4
-
Google Tag Manager
-
BigQuery
-
Looker Studio
-
Python
-
Cloud Run
-
Virtual Machine
-
-

Edtech
ClassTag
Project Outcomes
Setup and optimized event tracking for Class Tag’s web and mobile applications, improving data visibility and user engagement via Google Analytics 4 and Looker Studio.
Increased RR (Retention Rate)
+ 0 % RRUsed Technology
-
Looker Studio
-
Google Analytics 4
-
Google Tag Manager
-
BigQuery
-
How it works
Our Dashboard Development Process
-
1
Project Assessment
✔ Estimated time: 5 days
✔ We analyze your business needs and data infrastructure, and define KPIs (like CAC, ROMI, churn rate, LTV, etc) to ensure your dashboard tracks what matters to you most.
✔ Every project begins with an NDA for your data’s confidentiality.
-
2
Design+Development
✔ Estimated time: 2-3 weeks.
✔ We create clear and intuitive dashboards that simplify complex data.
-
3
Integration+Testing
✔ Estimated time: 2-3 days.
✔ Once finalized, we integrate dashboards with your existing data sources, test them for accuracy, and deploy – now you have real-time analytics for your business needs.
-
4
Deploy+Support
✔ Estimated time: up to 1 week.
✔ We provide post-deployment support through either team training or ongoing support via subscription (monthly/annually). Whether you continue with us or manage dashboards independently, we ensure a smooth transition and further success.
Costs of services
Our Data Consultancy Services Models:
-
Project-based:
HOURLY RATE FROM $49.
-
Subscription:
HOURLY RATE FROM $29.
-
Audit & Consulting:
HOURLY RATE FROM $59.
-
Ad-Hoc Inquiries:
HOURLY RATE FROM $69.
Our Team
Meet Our Dashboard Consultants
-
Ekaterina Kalabush
Data Analysts Lead

Ekaterina is proficient in dashboard consulting and data visualization.
Her deep understanding of analytics tools, together with a results-oriented approach, has helped many businesses worldwide track key metrics, boost ROI, and grow marketing and operations results.
-
Olexandr Voitovych
Data Visualization Engineer

Known for her cutting-edge approach to dashboard design and data visualization
Olexandr excels in creating dashboards that deliver actionable insights. His dedication to each project’s success is evident in his tailored, hands-on methodology, ensuring every dashboard optimizes data-driven decision-making.
-
Igor Bybka
Data Engineer

Ihor specializes in building data pipelines, optimizing data workflows, and ensuring smooth integration across diverse systems.
With a sharp focus on integration and visualization, he helps clients achieve smarter, faster, and more confident decisions.
Why Partner with us
Why choose Our Dashboard Consultants
-
Fast results
Start project in 1 week.
Get first insights in 2 weeks.
-
Industry Expertise
E-commerce, SaaS, EdTech, Healthcare, OTT, iGaming, Social Discovery/Dating, Web 3.0, Crypto and more.
-
Receptive Team
Acting as your in-house team of data engineers, data scientists, data analysts, and data solutions architects.
-
Effective Growth
Access to Full Team expertise – for the average fee of one in-house analyst.
Turn Big Data into Revenue with our Dashboard Consulting Team
We only partner with companies we’re 100% sure we can deliver results for.

our Testimonials
What our clients say
Need help?
Check our FAQs
-
What makes an effective business dashboard?
An effective business dashboard clearly visualizes performance metrics, facilitating quick and informed decisions. It combines dashboard usability testing, mobile dashboard accessibility, and performance metrics visualization to ensure it is both comprehensive and easy to navigate.
-
How do your dashboard consulting services improve business intelligence?
Our services enhance business intelligence by employing advanced dashboard reporting techniques and analytics dashboard integration, ensuring that your decision-makers have access to real-time, actionable insights from dashboards. This empowers teams to track progress effectively and make data-driven decisions.
-
What is the process for creating a custom dashboard with your firm?
The process begins with a consultation to understand your specific needs and objectives. We then proceed with design and development, incorporating your feedback throughout, followed by dashboard usability testing and integration into your business systems for a seamless experience.
-
How do you ensure dashboards are user-friendly and actionable?
We prioritize dashboard usability testing and focus on performance metrics visualization to ensure dashboards are intuitive and deliver actionable insights. Our emphasis on mobile dashboard accessibility also guarantees that users can access critical information anytime, anywhere.
-
Can you integrate dashboards with existing business systems?
Yes, analytics dashboard integration with your existing business systems is a key part of our service. This ensures that your new dashboards work seamlessly with your current workflows, enhancing rather than disrupting your operations.
-
How can I get started with your dashboard consulting services?
Getting started is simple. Contact us via our online form above. We’ll guide you through the initial consultation process to define your dashboard needs and objectives.
